Nasdaq 100 Breaks Below Key Technical Support As Momentum Fades
The tech-heavy index fell under its Ichimoku cloud with its money flow index reading just 9, while the S&P 500 formed a double top near 7,897.50.
The Nasdaq 100 broke below its Ichimoku cloud on Monday with a money flow index of 9, a level that signals heavily depleted buying pressure.
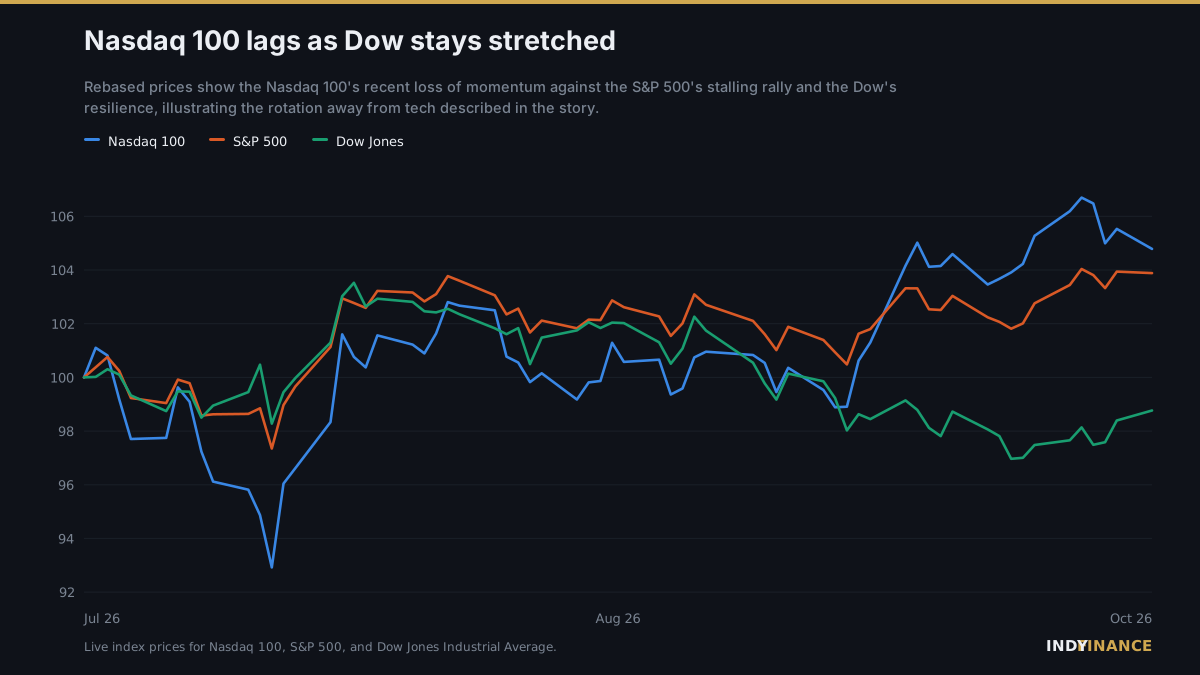
Nasdaq 100 lags as Dow stays stretched
Rebased prices show the Nasdaq 100's recent loss of momentum against the S&P 500's stalling rally and the Dow's resilience, illustrating the rotation away from tech described in the story.
Live index prices for Nasdaq 100, S&P 500, and Dow Jones Industrial Average.
Use this chart
Free to embed with attribution:
<figure><a href="https://www.indy.finance/news/nasdaq-100-breaks-below-key-technical-support-as-momentum-fades"><img src="https://www.indy.finance/news/nasdaq-100-breaks-below-key-technical-support-as-momentum-fades/graphic.svg" alt="Nasdaq 100 lags as Dow stays stretched" width="1200" height="675"></a><figcaption>Nasdaq 100 lags as Dow stays stretched — <a href="https://www.indy.finance/news/nasdaq-100-breaks-below-key-technical-support-as-momentum-fades">Indy Finance</a></figcaption></figure>If the S&P 500 closes back above 7,897.50 or the Nasdaq 100 reclaims its Ichimoku cloud in coming sessions, the bearish momentum read would be invalidated.
- Investing.com — All NewsNasdaq 100 breaks below Ichimoku cloud with MFI at 9: LiveExternal ↗
- Investing.com — All NewsS&P 500 double top at 7,897.50 as momentum fades: Live levelsExternal ↗
- Investing.com — All NewsDow Jones overbought below 200 SMA at 52,570: Live levelsExternal ↗
Produced automatically by the INDY NEWS Desk from the public wire sources cited above, and checked against them before publication. Market commentary, not investment advice.